
The world of Social Media can be scary. Often, even the savviest marketers struggle to understand the difference between Impressions, Engagements, and Clicks.
Moreover, determining what channel is best for you, and where to run ads can be a challenge. Then you have to create the ads (or find someone to create them for you), optimise, reflect and monitor your performance.
Impressions, engagements, clicks, retweets, likes, shares, comments, replies, engagement rates – what does it all mean? And what really matters when creating and gauging the success of content?
The “Social Media lingo”
Before looking in to analytics, it’s important to know what each term means. You might have Googled an impression, and still be a bit confused. What’s the difference between an engagement and an impression? Which one matters more?
Do not panic – we are here to help.
- Impressions – put simply, and impression is a singular view of your specific post. At some point in time, your post has appeared and dominated the full screen of a Facebook users’ device. They may not have clicked on the content – but they’ve seen it. Impressions are an indication of Brand Awareness, and can be effective in measuring how many people are encountering your organisation on social.
- Engagements – an engagement is thereafter when an individual goes beyond viewing a post. They do not need to like or comment, an engagement could be a little as clicking on the image itself. Engagements are a key indicator of successful content, as the user has been interested or driven enough to interact.
- Clicks – clicks are a form of engagement, but may go beyond simple clicks on the post. A click may involve a clicked link, which could lead to a website visit, and generates a warm lead for business.
Starting with these three metrics, we can see a pipeline establishing already. The goal, as with any form of marketing, is to drive reach and messaging that evokes an engaging message.
By increasing your number of impressions on content that is engaging, you can drive then the number of engagements, which creates more clicks, which generates more leads.
Hootsuite, a leading social media platform, visualises this flow of users as below:
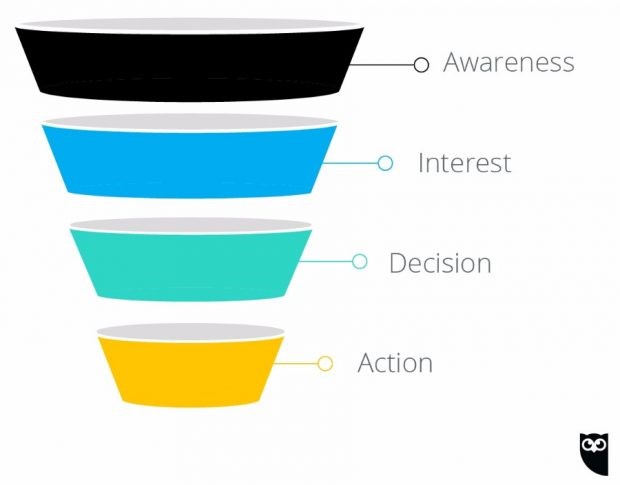
The goal therefore is to:
- Maximise awareness, or impressions
- Use engaging content that converts those impressions to engaged users, or interest groups
- Convert those engagements into warm leads who visit your website, or Social Channel
- Encourage the user to comply with your call to action
Measuring success
Okay – you understand the terminology now, but how can you measure success?
Every social channel provides surface level, easy to read dashboards for their users. You can also access programmes and software that will run analytics for you, such as Hootsuite, Orlo or Hubspot.
Those software options however come with a price, and often the level of depth in their analytics reporting is questionable.
The best way to get the greatest insight is to get yourself in to the data, and learn how to read it.
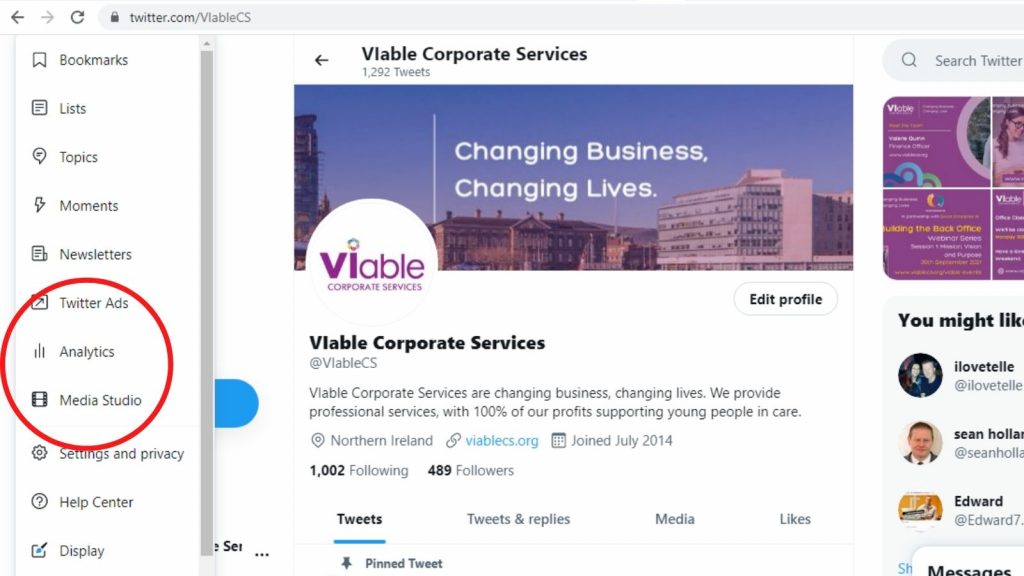
To access your analytics spreadsheets on Twitter:
- Click “more” on the dashboard on the left on a desktop
- Click “analytics”
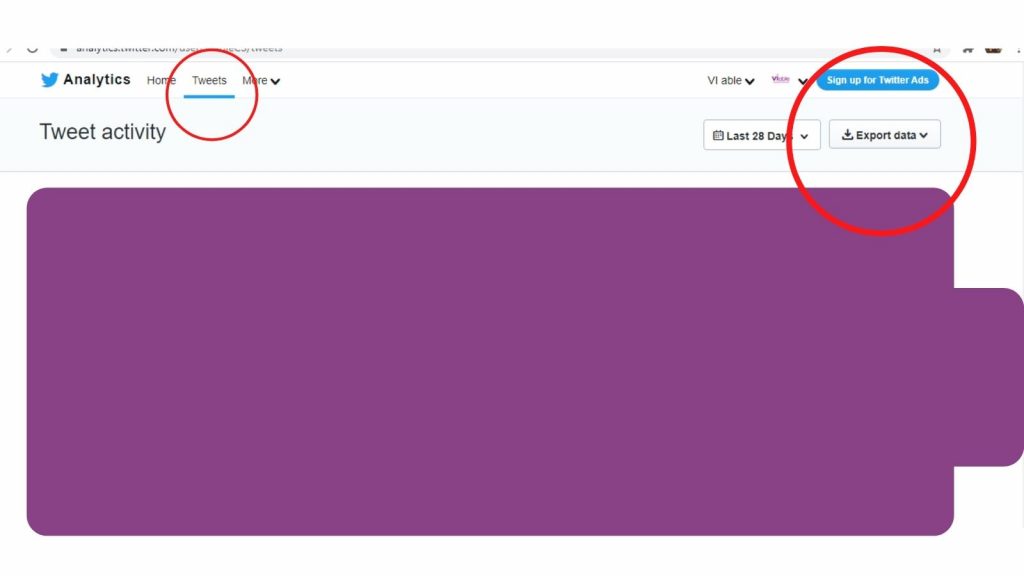
- At the top of this page, click the tab “Tweets”
- Now select “Export data”, and choose by Tweet or Day for the required month
After, Twitter will then churn out an analytics file, with every Tweet, number of impressions, engagements and relevant information for your use.
You can access this file on Excel, then total columns and start actively recording straight from the spreadsheets how you are performing.
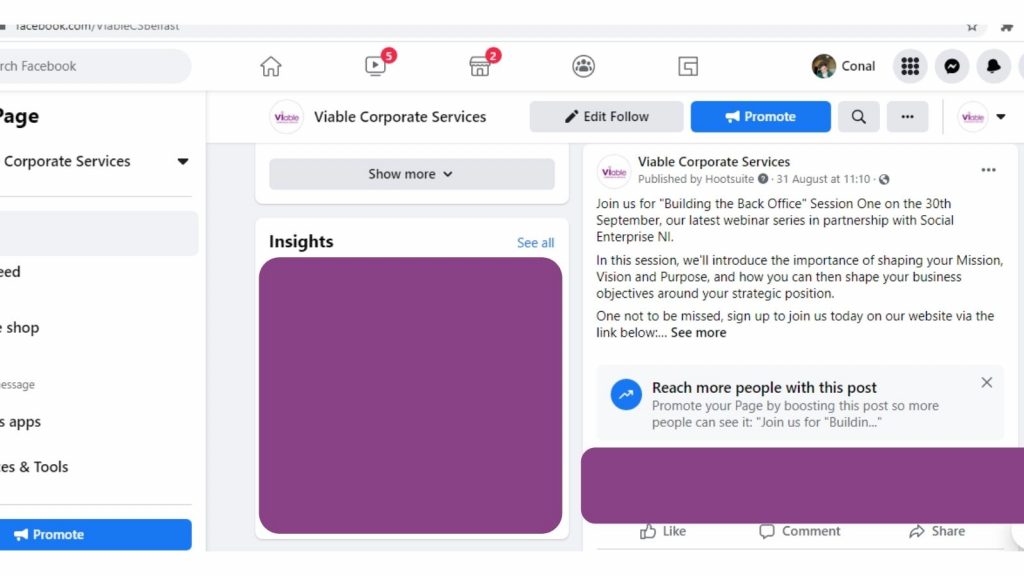
Similarly to Twitter, Facebook will provide an insights dashboard that gives a surface level indication of performance.
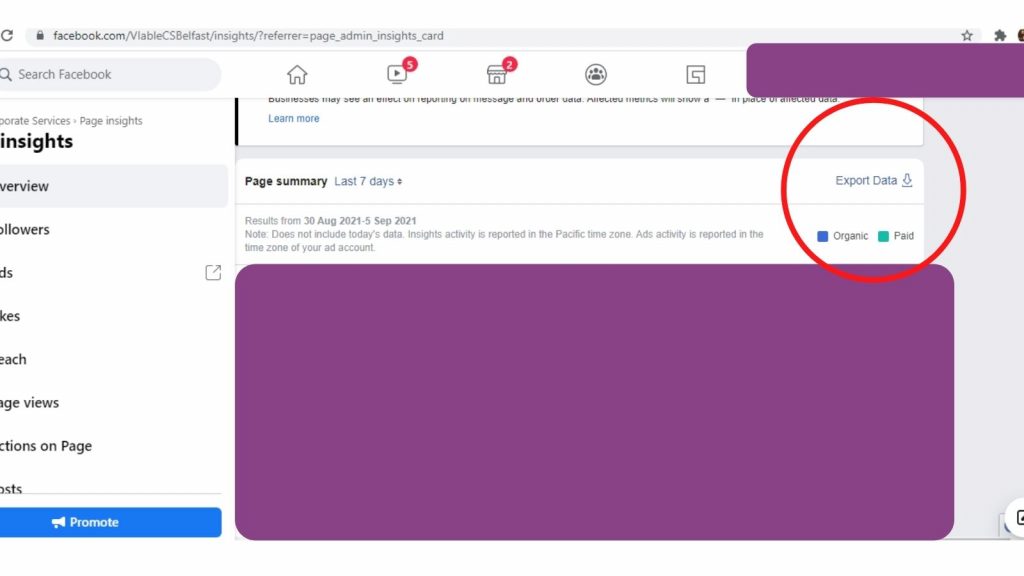
On Facebook, to access your full data spreadsheet:
- Go to insights
- Click “See all”
- Click “Export data”, and select the correct time period, exporting all your page data
Here, you’ll want to total the columns for “Daily Total Reach”, “Daily Total Engaged Users”, “Daily Total Organic Reach” and “Daily Total Paid Reach”.
Facebook reports on both Reach and Impressions. Reach in this scenario gives a truer impact of the number of individuals you reached, whereas Impressions will include multiple counts of the same person.
As reach is more figuratively true, it makes more sense to report on it over impressions for Facebook.
Using the spreadsheets
When you first open a Social Media spreadsheet, it can be a bit overwhelming. There are so many numbers, and it can be hard to know where to start, or what you are looking to report on.
When you open the dataset, think back to Hootsuite’s definition of the social funnel. You are looking to track your customers’ journey around your social media content.
For a basic start, we suggest you report on:
- Total monthly impressions or reach
- Total engagements
- Average monthly engagement rate
- Likes, retweets, share or comments
- Clicks
Reporting on these 5 matrices for each channel can help you determine how your social content is performing, your reach and awareness, and how many clicks or leads that content is generating.
Thereafter, it is about identifying what performs well, what doesn’t, and how do you optimise that strategy continuously over time.
Social media is a beast – but with small changes in approach, it can be conquered.
At VIable, we understand that analytics and reporting can be time-consuming. Reporting on marketing success is also quite challenging, and identifying relatable KPIs that equate to revenue generation is often the biggest challenge for any marketing department.
At VIable, we provide support in Marketing Analytics. Our experts have created Excel tables that extract the key data you need, and provide accompanying written reports analysing your overall performance.
If you need support with Marketing Analytics, reach out to us at info@viablecs.org, or learn more over on our Marketing Page here today.

Recent Comments